一、配置文件
进入到如下的配置文件
[root@localhost ~]# vim /etc/telegraf/telegraf.conf
[global_tags]
[agent]
#收集数据的间隔
interval = "10s"
round_interval = true
metric_batch_size = 1000
metric_buffer_limit = 10000
collection_jitter = "0s"
#写入inflxdb的时间间隔
flush_interval = "10s"
flush_jitter = "0s"
precision = ""
debug = false
quiet = false
#日志路径
logfile = "/data/log/telegraf.log"
hostname = ""
omit_hostname = false
[[outputs.influxdb]]
urls = ["http://192.168.227.56:8086"]
database = "telegraf"
username = "admin"
password = "123456"
[[inputs.cpu]]
#是否采集每个CPU的数据
percpu = false
#是否采集总CPU的数据
totalcpu = true
collect_cpu_time = false
report_active = false
二、启动Telegraf
[root@localhost data]# systemctl start telegraf.service
[root@localhost data]# service telegraf status
开机启动
[root@localhost data]# systemctl enable telegraf.service
三、在inflxdb验证数据(inflxdb数据库所在的机器)
[root@localhost ~]# influx -username 'admin' -password '123456' -database telegraf
select * from cpu limit 3
name: cpu
time cpu host usage_guest usage_guest_nice usage_idle usage_iowait usage_irq usage_nice usage_softirq usage_steal usage_system usage_user
1598452090000000000 cpu-total localhost.localdomain 0 0 97.93294681121132 0.17645576002015695 0.15124779430301213 0 0.07562389715150607 0 0.8822788001008564 0.7814469372322055
1598452090000000000 cpu0 localhost.localdomain 0 0 98.58870967742497 0 0.20161290322583764 0 0 0 0.5040322580645762 0.7056451612904496
1598452090000000000 cpu1 localhost.localdomain 0 0 98.5901309164208 0 0.10070493454176956 0 0.10070493454178744 0 0.5035246727089193 0.70493454179253
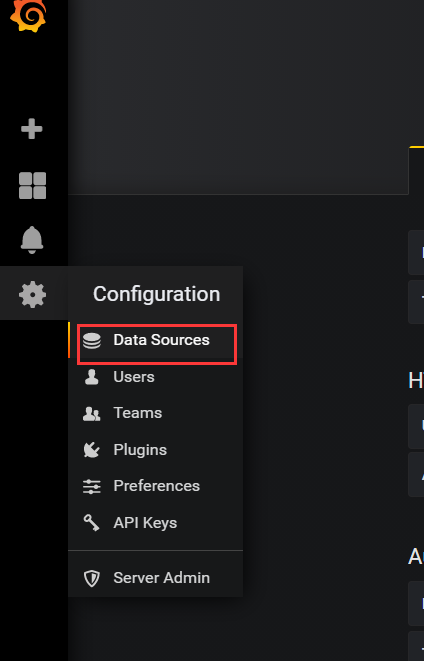
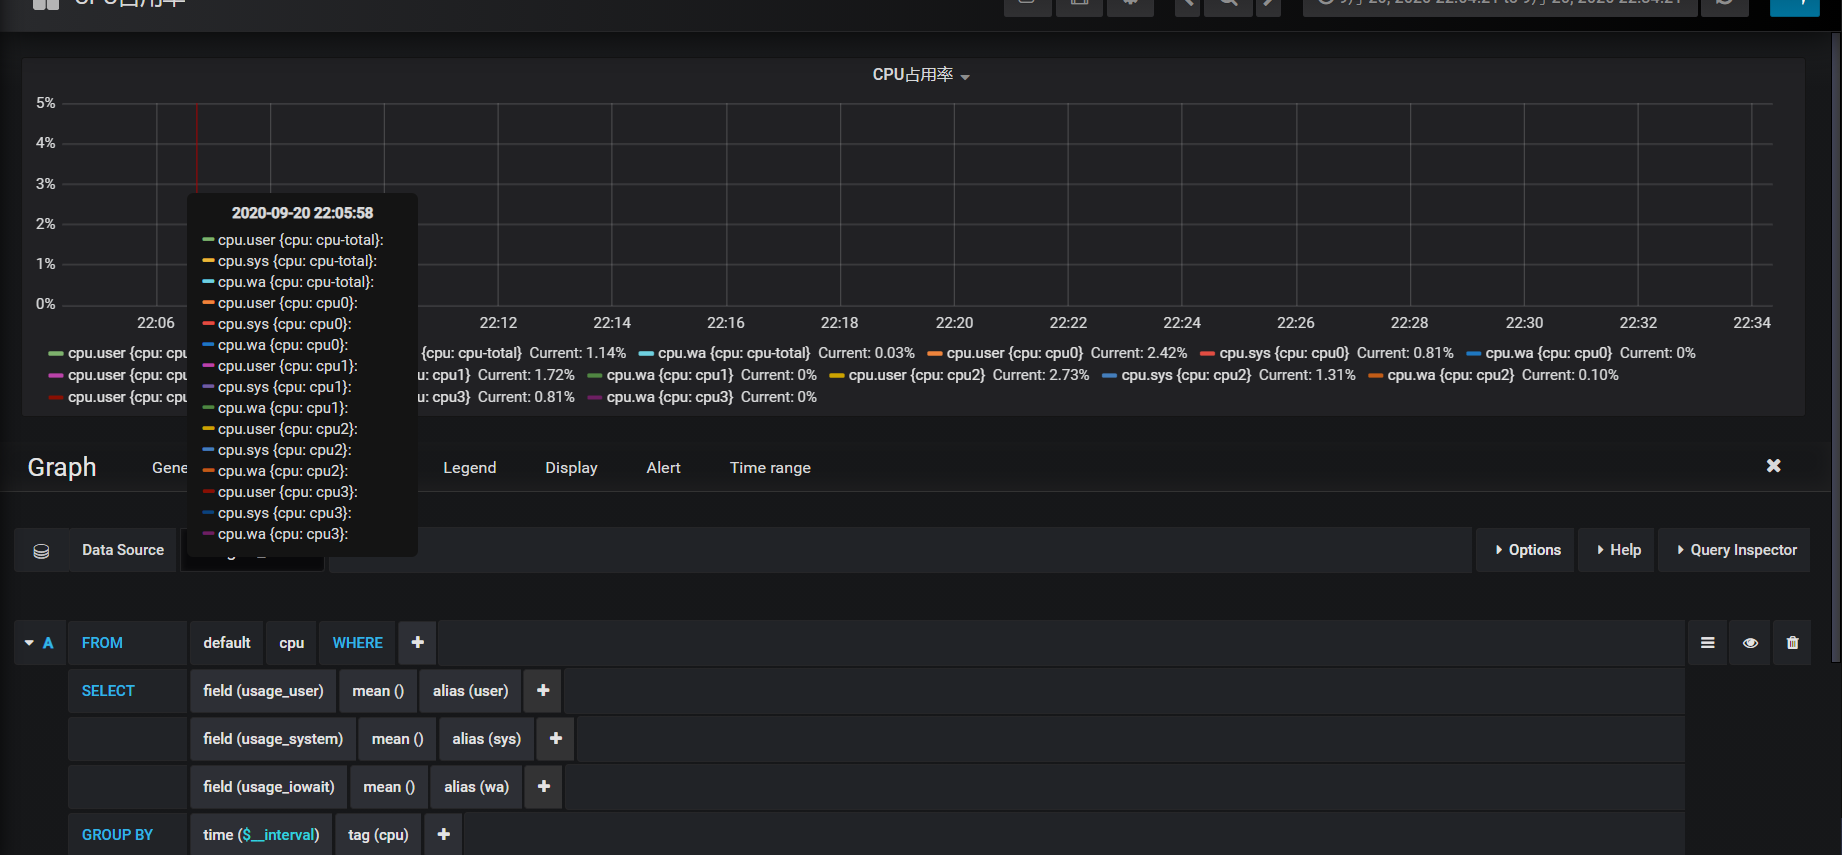
四、在grafana展示监控CPU的数据
- 点击设置选择“data sources"
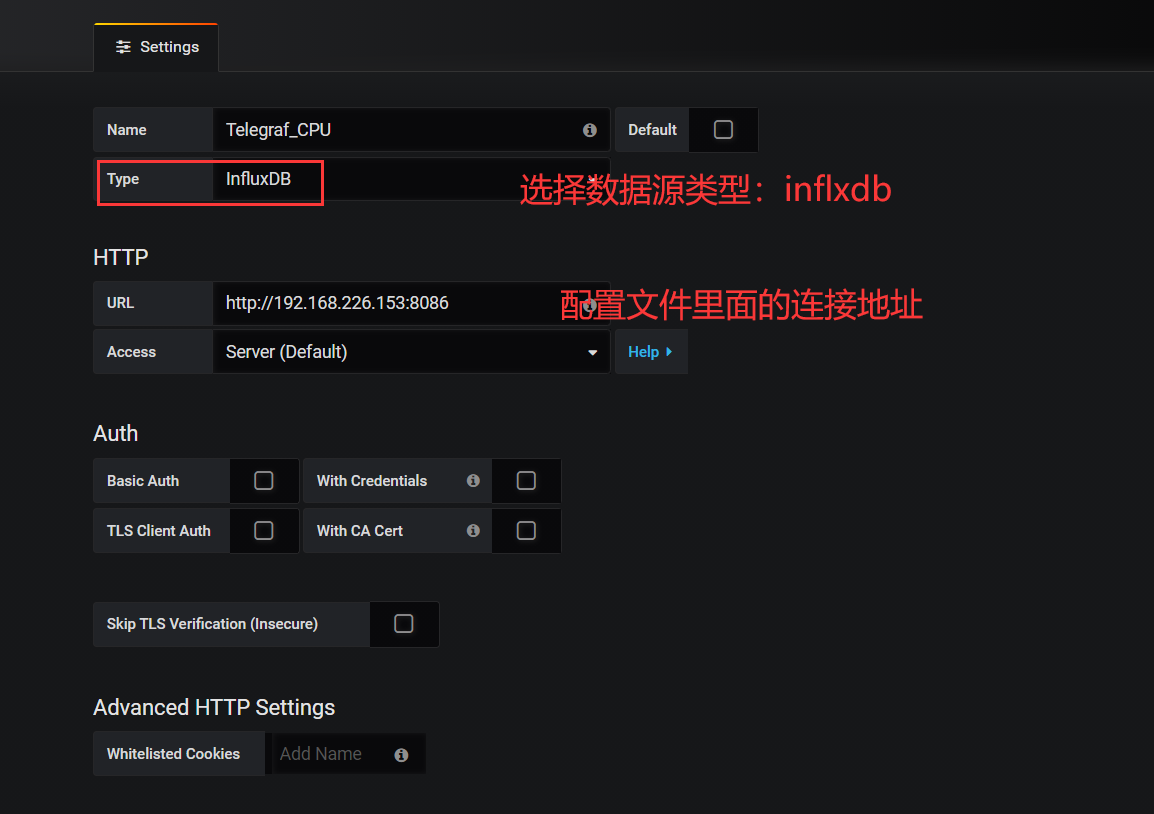
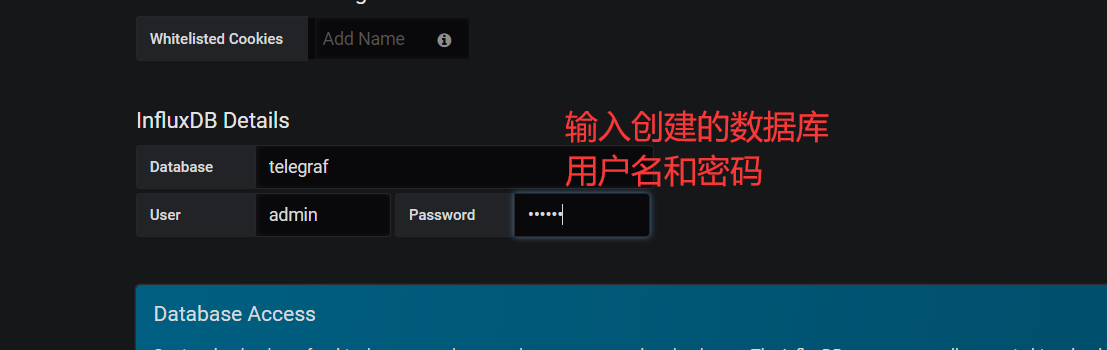
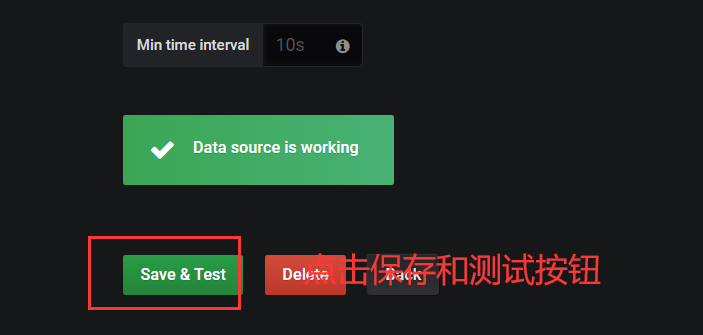
- 配置数据源
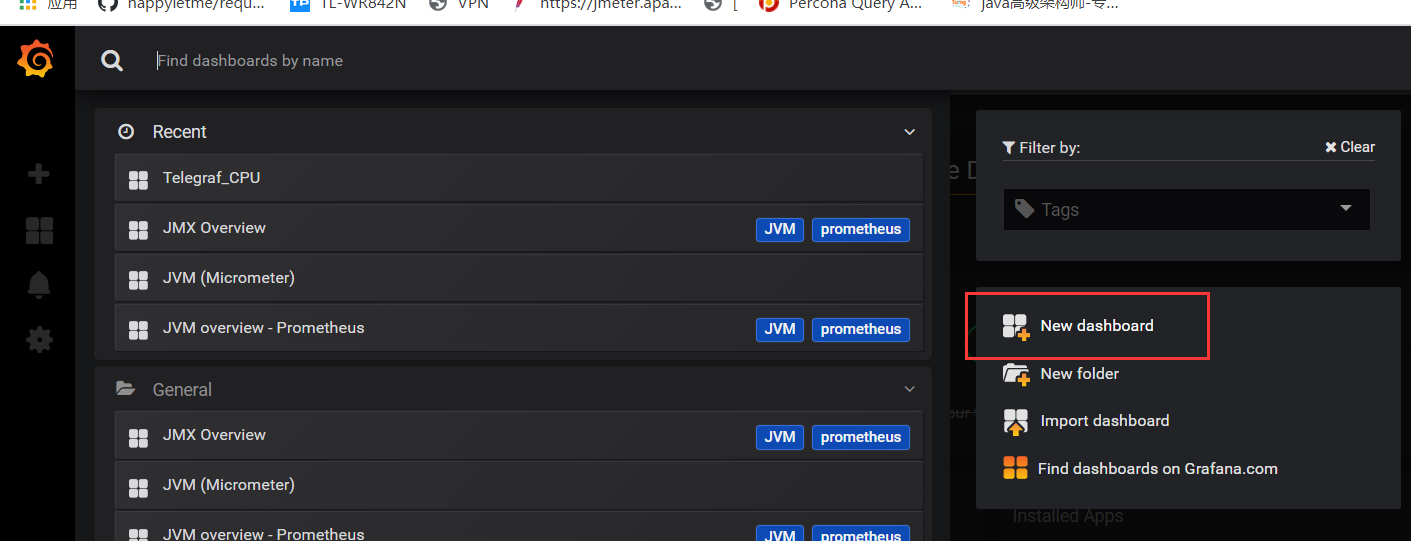
- 创建面板

点击new dashboard按钮
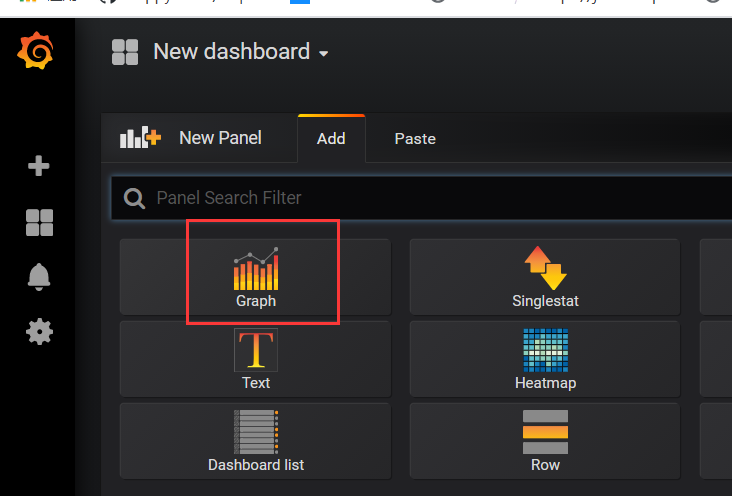
点击Graph图标
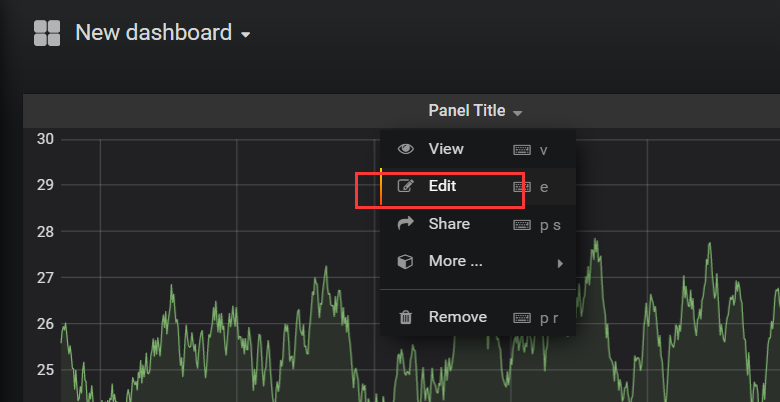
点击“edit”按钮
选择数据源
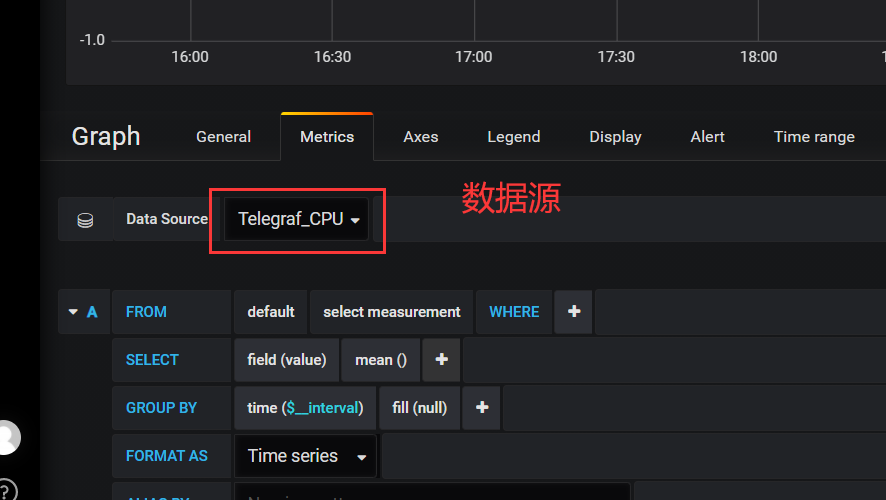
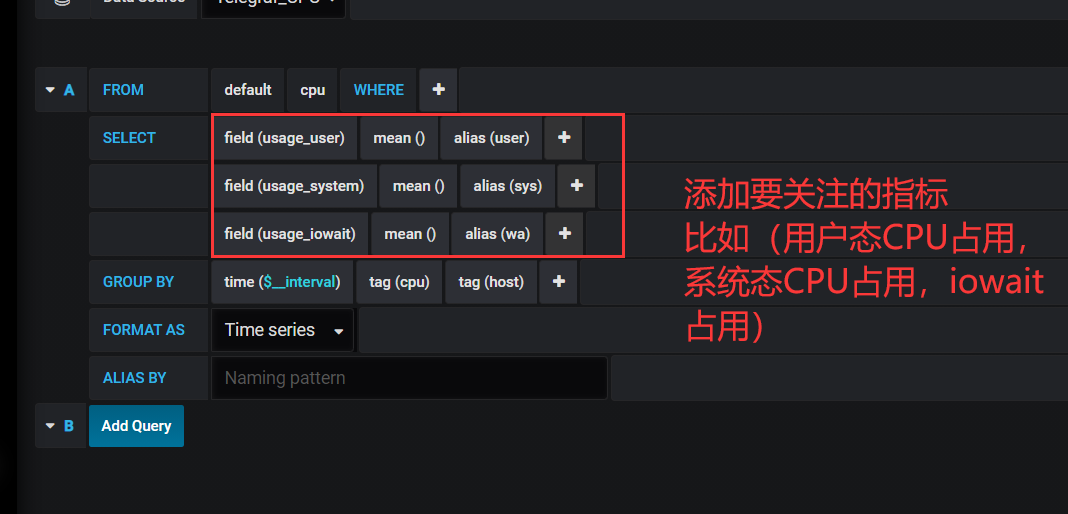
添加需要关注的指标值:
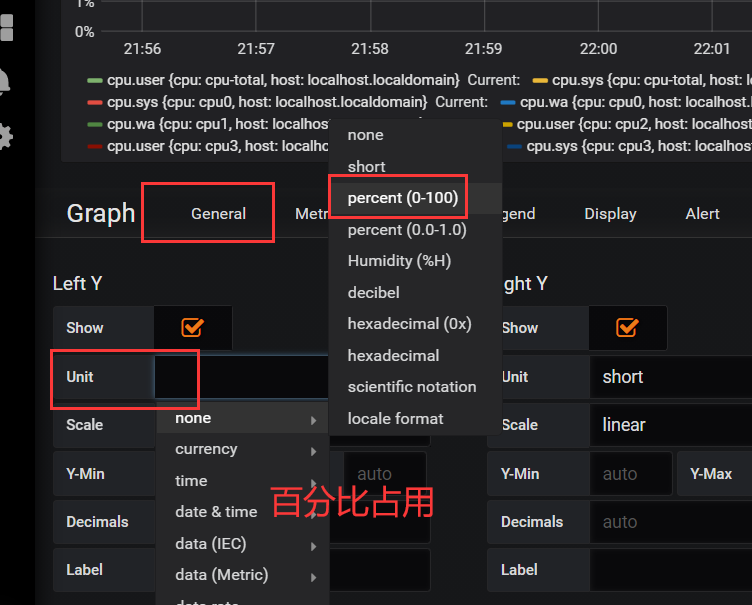
百分比占用显示:
五、选择保存默认项
[root@localhost telegraf]# vim /etc/telegraf/telegraf.conf
对CPU只采集的监控项
fieldpass = ["usage_user","usage_idle", "usage_iowait", "usage_system"]
重启telegraf
[root@localhost telegraf]# systemctl restart telegraf
六、在inflxdb上面重新采集数据
[root@localhost ~]# influx -username 'admin' -password '123456' -database telegraf
use telegraf;
drop measurement cpu;
选择刷新频率和线上的时间段
欢迎来到testingpai.com!
注册 关于