prometheus语法
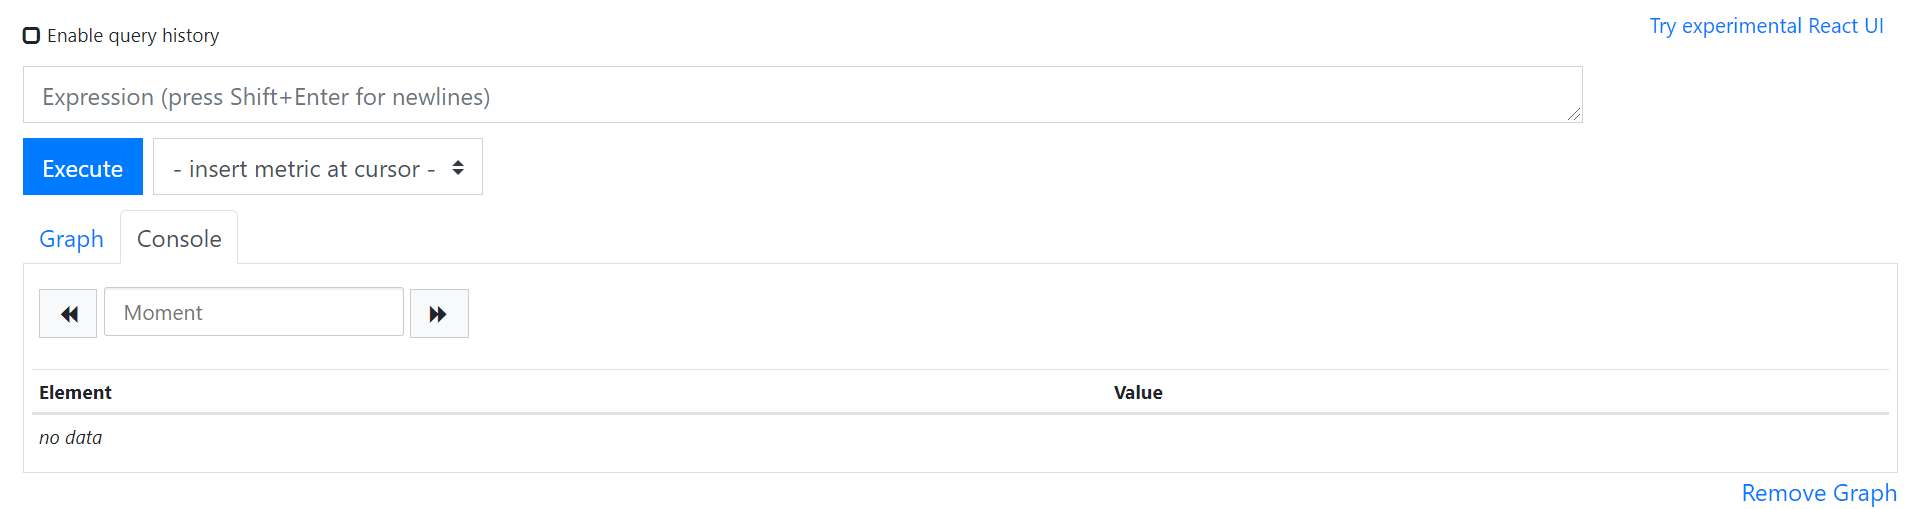
如果prometheus正常启动,在防火墙开放了9090端口时,可以通过浏览器访问 http://机器ip:9090 直接访问
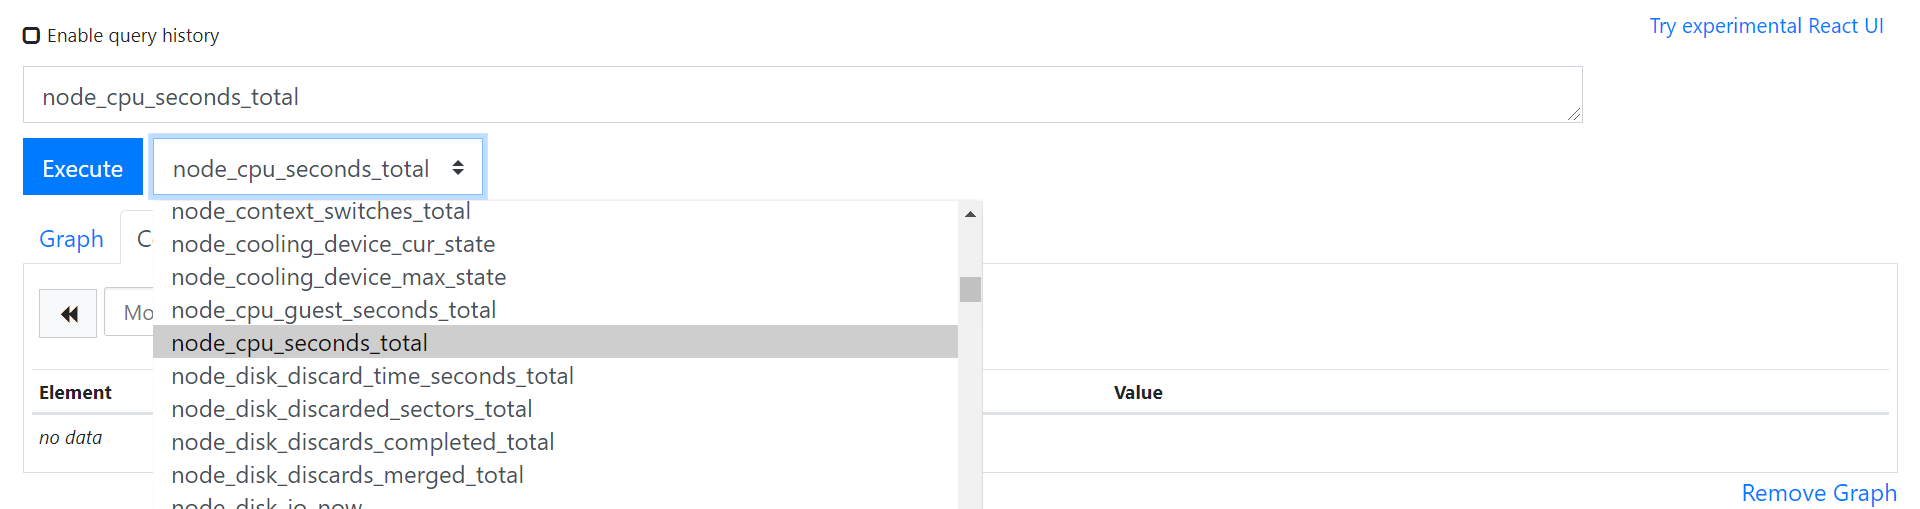
在页面中“insert metric at cursor” 中选择查看的监控对象,如 node_cpu_seconds_total 然后点击 Execute 按钮
再切换到 graph
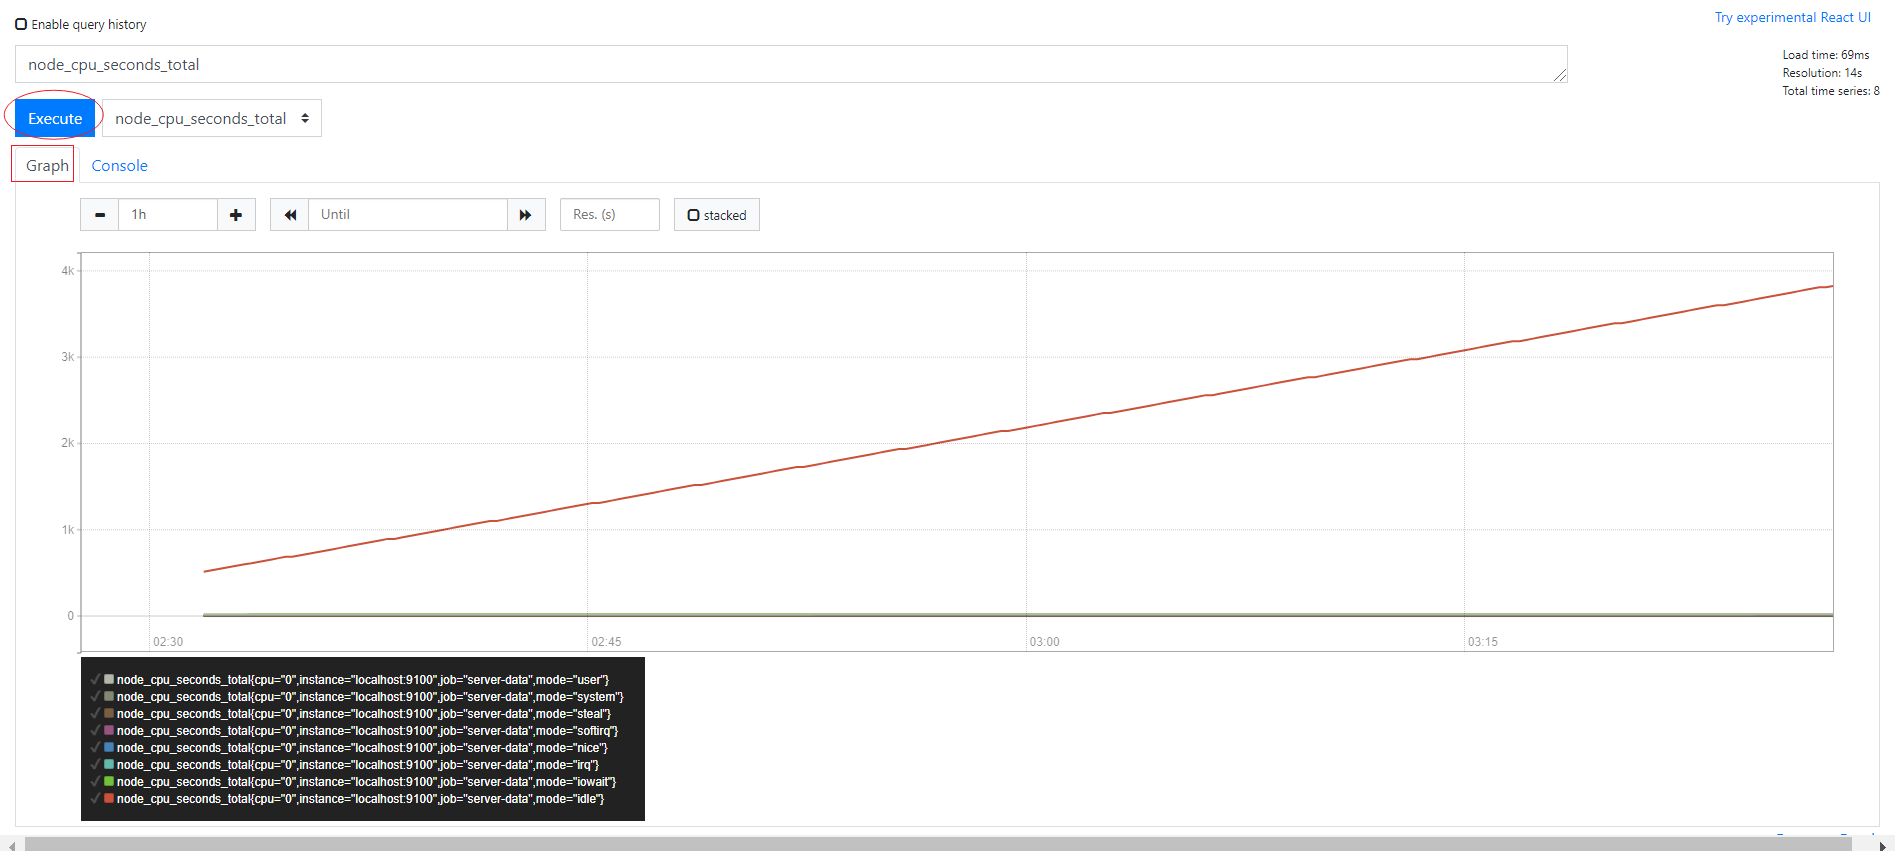
此时,我们已经看到了服务器cpu资源监控图
如果没有出现图,可能是因为时间跨度区间太长,可以点击 graph标签下面的 "- +"来调整图表时间区间,缩小区间,就能看到时间了。
设置标签匹配器
- 这个功能类似,sql语法中where条件语句,不过在使用时,要用 {} 大括号,括号中间写条件,多个条件之间用逗号。
eg:
# 条件匹配
node_cpu_seconds_total{cpu="0", mode="system"}

# 点击 execute
点击 execute 按钮之后,graph中就只有1个图形线了。
逻辑符号除了上面用的 ‘=’ 还可以用
- = 等于
- != 不等于
- =~ 等于正则式匹配值
- !~ 不等于正则式匹配值
eg:
# 模糊匹配
node_cpu_seconds_total{cpu="0", mode=~"user|system|irq"}

# 点击 execute
点击 execute 按钮之后,graph中就会看到 3 条图形线。
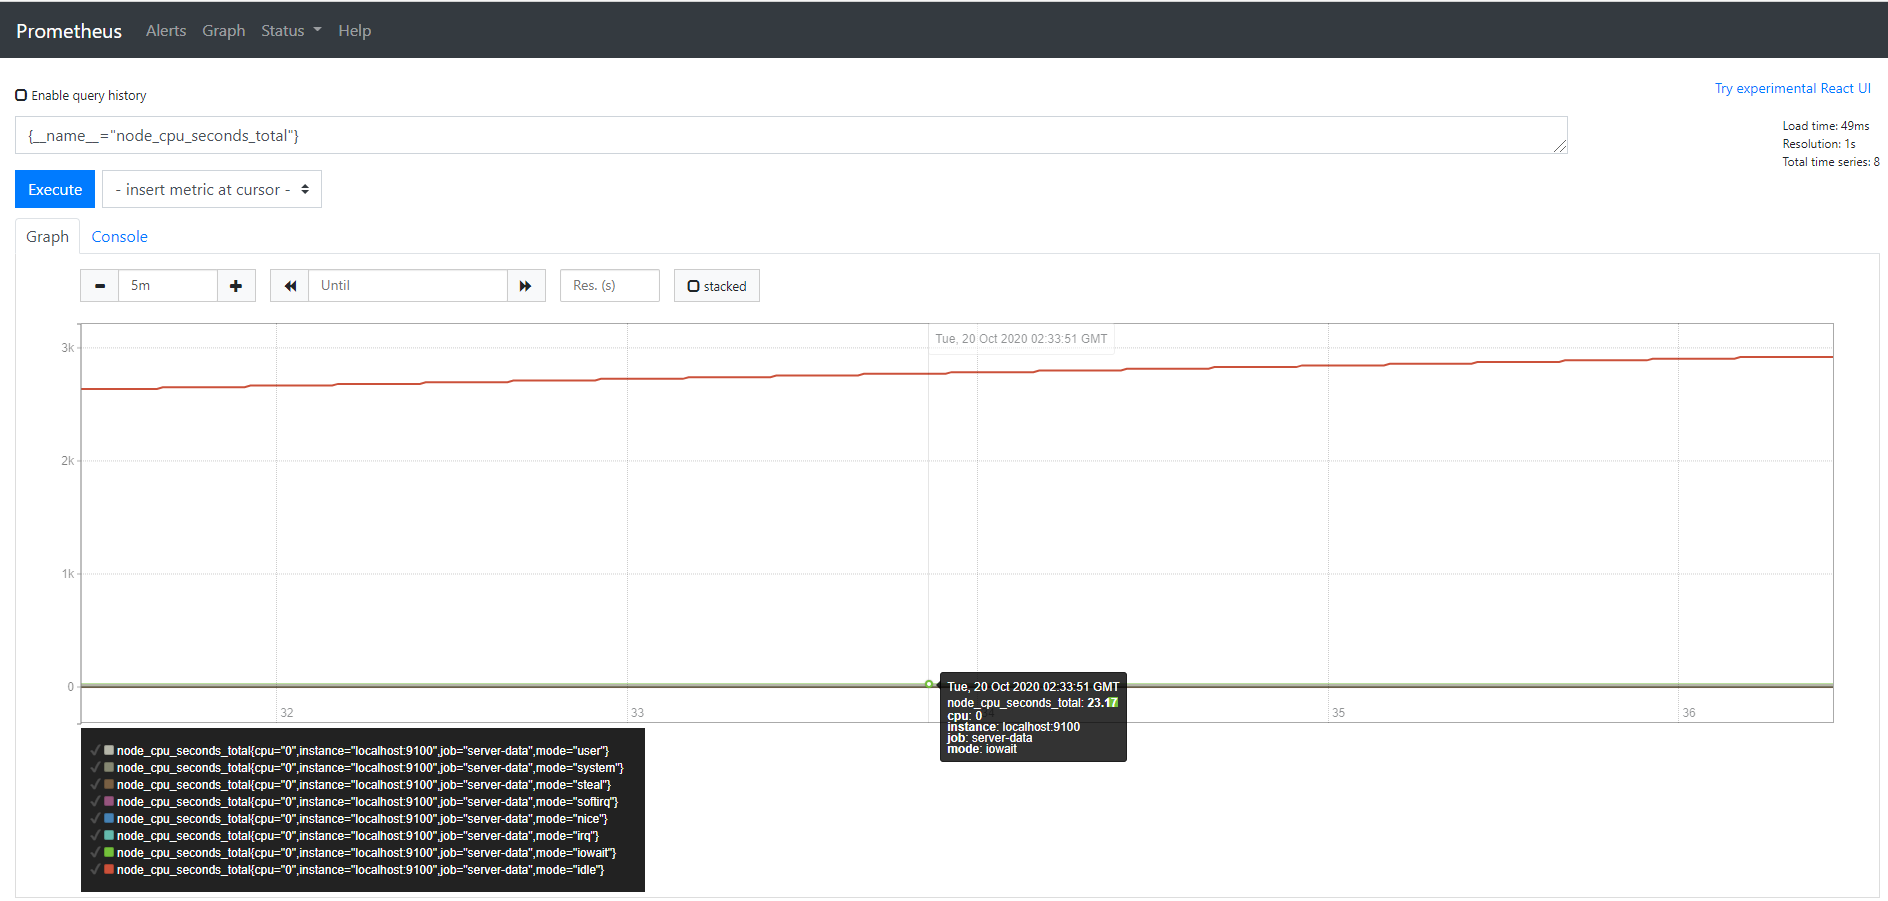
- 可以使用__name__ 直接匹配指标名称
eg:
# 精确匹配标签
{name="node_cpu_seconds_total"}

# 模糊匹配标签
{name=~"node_cpu.*"}
但是,指标名称不能是关键词: bool、on、ignoring、group_left、group_right
# 标签名,不能是关键字

on{name=~"node_cpu.*"}  # 这个会报错
设置范围取值器
- 这个功能类似,sql语法中的between语句,实现区间取值,不过它使用 [] 中括号,括号中写范围
eg:
# 15分钟

irate(node_cpu_seconds_total{mode="user"}[15m])
- 持续时间单位可以是:
-
ms 毫秒,eg:150ms
-
s 秒,eg:60s300ms
-
m 分钟, eg:5m15s
-
h 小时, eg:3h5m
-
d 天, eg: 1d
-
w 周, eg: 1w
-
y 年, eg: 1y
时间偏移
- 这个功能类型sql语法中的offset,语法实现也是用 offset
# 偏移20分钟
node_cpu_seconds_total offset 20

msum(node_cpu_seconds_total{mode="user"} offset 5m)
重点函数
- abs() 返回绝对值
- delta() 求差值
- floor() 四舍五入
- hour() UTC时间小时
- idelta() 时间计算
- increase() 按时间增加
- irate() 增长率
- rate() 平均增长率
- ln() 自然对数
- log2() 二进制对数
- log10() 十进制对数
- minute() UTC时间分钟
- month() UTC时间月
- round() 取整
- sort() 升序
- sort_desc() 降序
- sqrt() 求平方根
- time() UTC秒
- timestamp() 时间戳
- year() UTC年
欢迎来到testingpai.com!
注册 关于