一、下载redis_exporter安装包
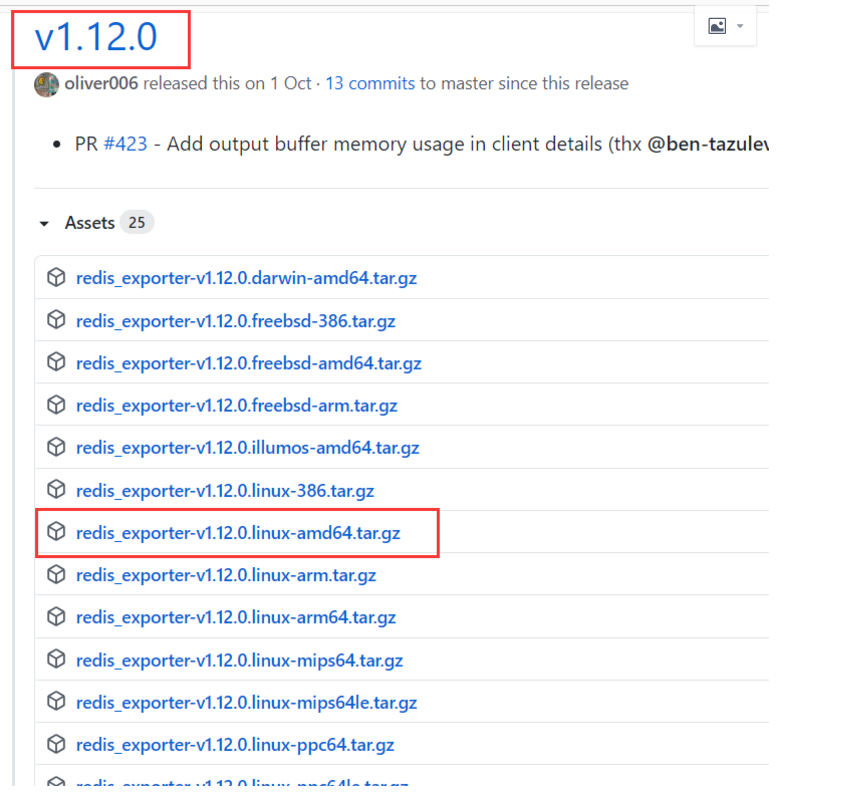
从GitHub上面下载安装包,这里选择了v1.12.0
https://github.com/oliver006/redis_exporter/releases/tag/v1.12.0
在Linux某个目录下面直接下载:
[root@localhost data]# wget https://github.com/oliver006/redis_exporter/releases/download/v1.12.0/redis_exporter-v1.12.0.linux-amd64.tar.gz
二、解压安装
#redis_exporter不一定需要和Redis在同一台机器上面,解压到Prometheus安装目录下面
解压
[root@localhost data]# tar -zxvf redis_exporter-v1.12.0.linux-amd64.tar.gz -C /usr/local/prometheus/
三、编写启动脚本,没有密码的模式
[root@localhost redis_exporter-v1.12.0.linux-amd64]# vim start_redis_exporter.sh
#!/bin/bash
HOSTIP=192.168.226.150
nohup /usr/local/prometheus/redis_exporter-v1.12.0.linux-amd64/redis_exporter -redis.addr $HOSTIP:6379 -web.listen-address 192.168.226.153:9121 &
四、启动redis_exporter服务
[root@localhost redis_exporter-v1.12.0.linux-amd64]# sh start_redis_exporter.sh
五、配置Prometheus
- [root@localhost prometheus]# vim prometheus.yml
-
job_name: 'redis'
scrape_interval: 10s
static_configs:
- targets: ['192.168.226.153:9121']
- 重启Prometheus服务
[root@localhost prometheus]# systemctl restart prometheus
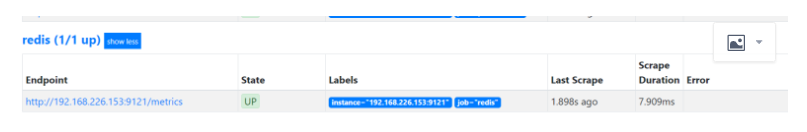
- 配置成功之后,查看Prometheus的监控Redis是UP状态
http://192.168.226.153:9090/targets
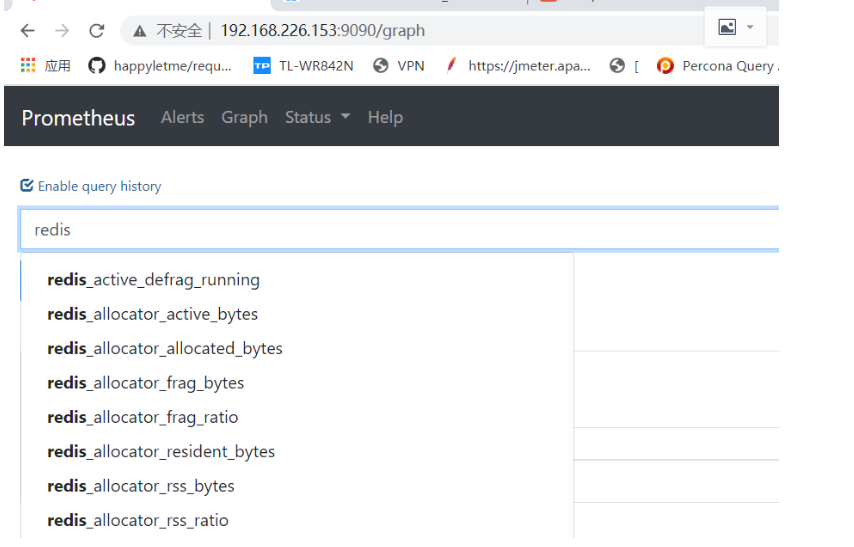
- 在搜索框输入“redis”可以查看到所有的指标信息
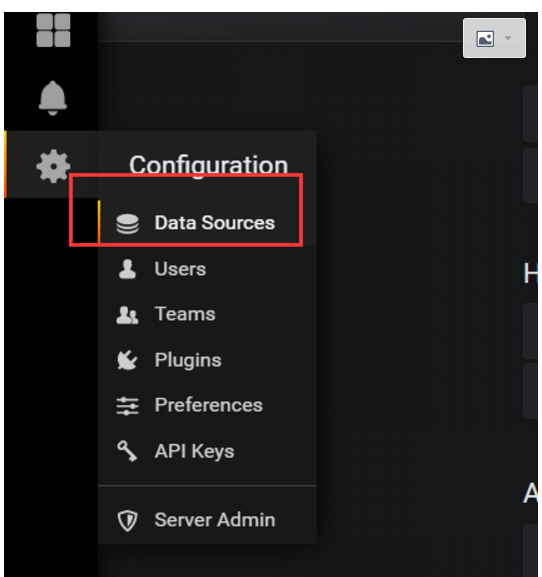
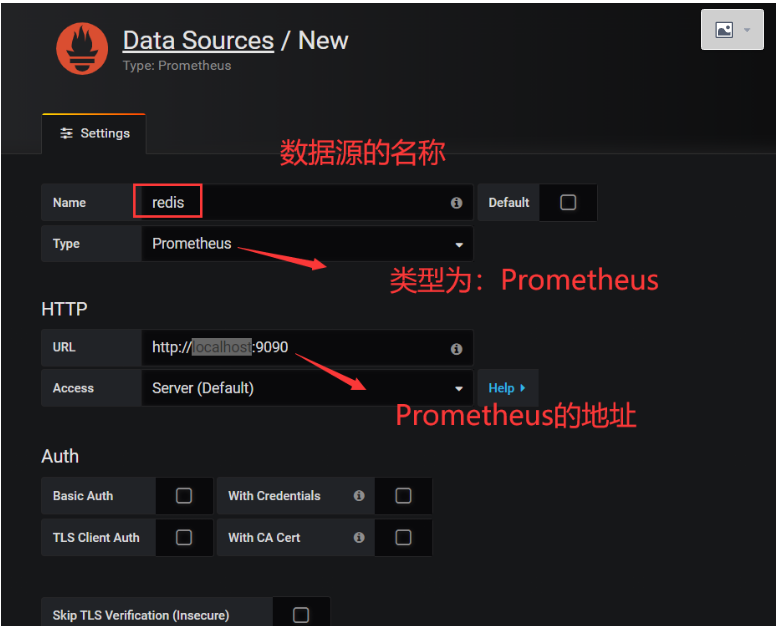
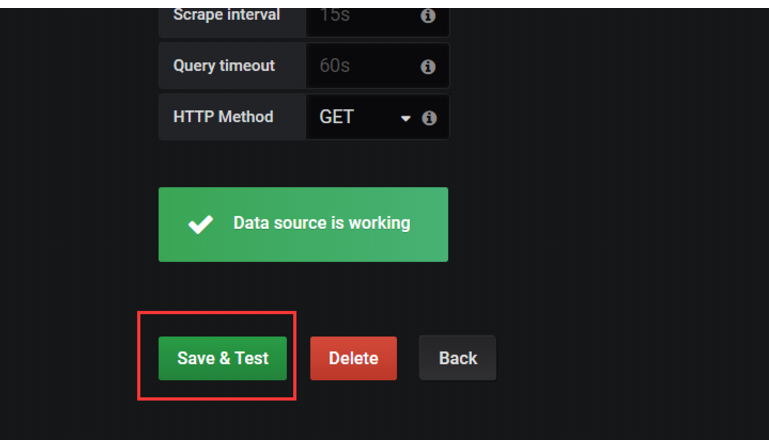
六、在grafana里面配置Prometheus的连接
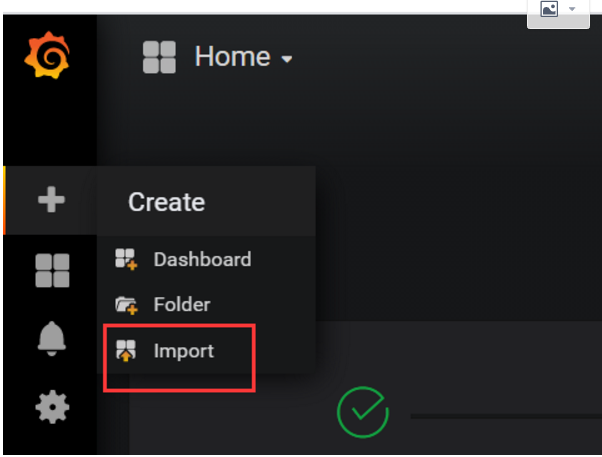
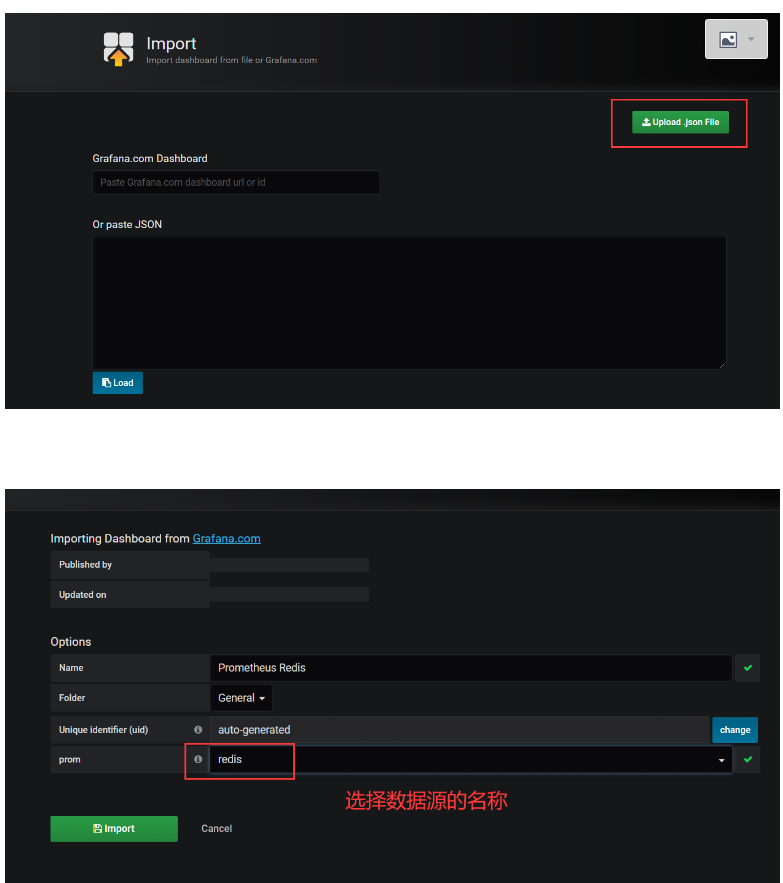
七:导入json模板
- 下载prometheus-redis_rev1.json模板
https://grafana.com/api/dashboards/763/revisions/1/download
- 导入
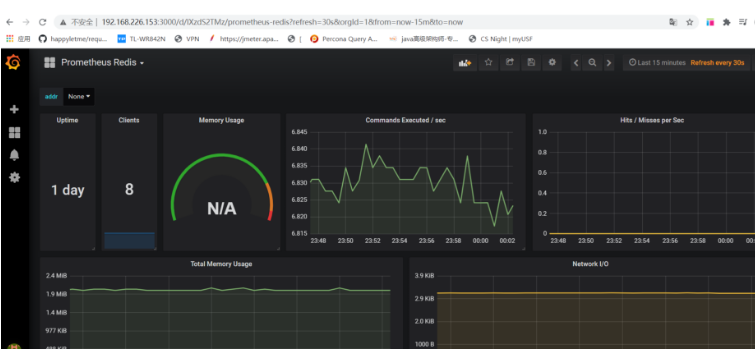
最后显示的监控图
欢迎来到testingpai.com!
注册 关于